Demonstration case two (Greece): Integrating open-source satellite data with farm-level data


Demonstration case two: Integrating open-source satellite data with farm-level data
An overview of demonstration case two, in Greece, in which a data aggregation platform was developed to illustrate the potential of aggregated data to aid with the monitoring and evaluation of the Common Agricultural Policy (CAP) and to support farmers and their advisors with improving farming practices.
The demonstration case in Greece builds on the assumption that digital agricultural technologies demonstrate the potential to simultaneously fulfil two objectives. Firstly, to enable the implementation of good and sustainable agricultural practices that provide clear benefits for farmers and the environment. And secondly, to enable the delivery of farm-level data, namely the impact of applied agricultural practices, which could potentially be used to monitor and evaluate the CAP.
During the demonstration case, we considered which policy indicators could be calculated at farm-level (either at a single farm or a group of farms) and shared with farmers, farmers advisors and potentially with policy monitoring authorities.

Providing innovative and valuable data
The initial implementation of the data aggregation platform exploits datasets from a commercial Farm Management Information Systems (FMIS) called “gaiasense” developed by Neuropublic. The functionality of the “gaiasense” smart farming system was extended to enable it to address new CAP monitoring needs and provide farmers with innovative and valuable data.
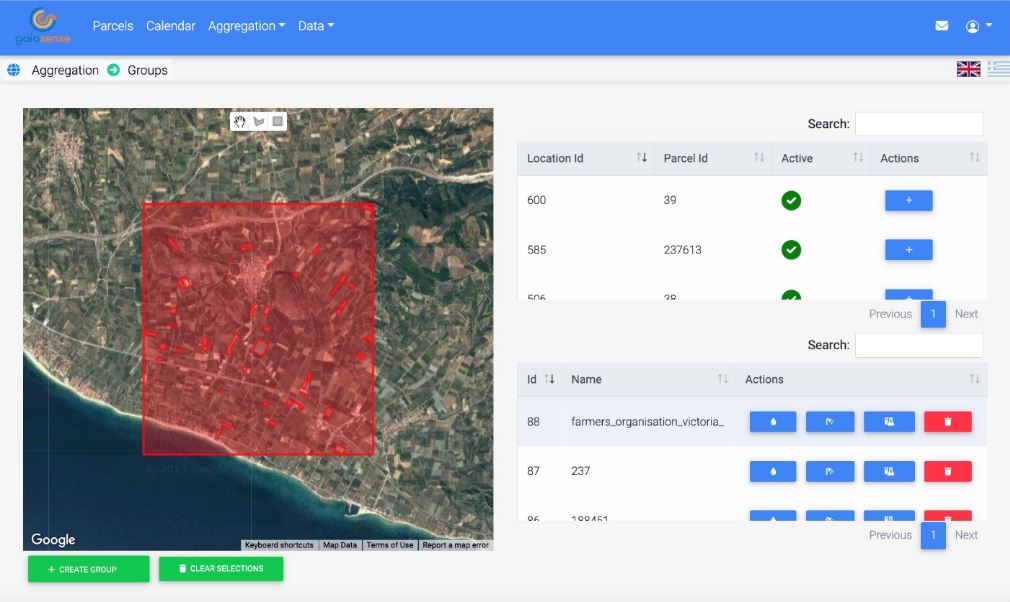
In this context, a new agro-environmental data management and aggregates calculation platform has been successfully developed and demonstrated. The calculation of the policy indicators is based on existing records maintained in digital farm calendars through data aggregation methods. The platform can collect, aggregate, and visualise farm-level cultivation-related data, such as cultivated crop types, harvested yields, utilised pesticides, irrigation and fertilisers.
Aggregates are calculated in the following manner:
- Time-based: Calculated using set timeframes, such as cultivation cycle, on a yearly or monthly bases.
- Intervention based: Calculation of quantitative aggregates referring to specific cultivation practices e.g., irrigation, pest management, fertilisation, harvests yield.
- Location/area based: Calculated for an individual farm or for a group of farms. The group is created by the user of the platform.
Throughout the demonstration case, we collaborated with farmers, supporting them with new digital technology. Farmers who consented to share their calendars and aggregate calculations also received selected calculated outcomes. We expect that this data-sharing approach will prove rewarding for individual farmers, incentivising them to share their data and pool resources.
Data challenges
We came across a number of obstacles during this demonstration case, including data protection, data quality and calculation methodology. To achieve the full potential of the project, we needed to obtain and share data from individual farmers. We were able to achieve this by following data protection regulations (GDPR). Data quality was a higher concern. Empty values and incorrect entries in farmer’s calendar could result in low-quality aggregates. This issue was mitigated through data curation and refining mechanisms, excluding farms with no or incorrect dataset and cross-checking and evaluating the final results.
Finally, it's not straightforward to calculate aggregates on utilised pesticides, so this was our final obstacle. This was solved by utilising more generic aggregation calculation approaches, for example, we took the top three utilised active substances instead of aggregating the quantities of pesticides.
Extending the platform further
The agro-environmental data management platform could potentially be extended to different cultivation types, aside from the ones selected for this demonstration case. The only prerequisite is to have a clear and complete set of data stored in the FMIS system. This demonstration case has shown that this platform has a lot of potential.

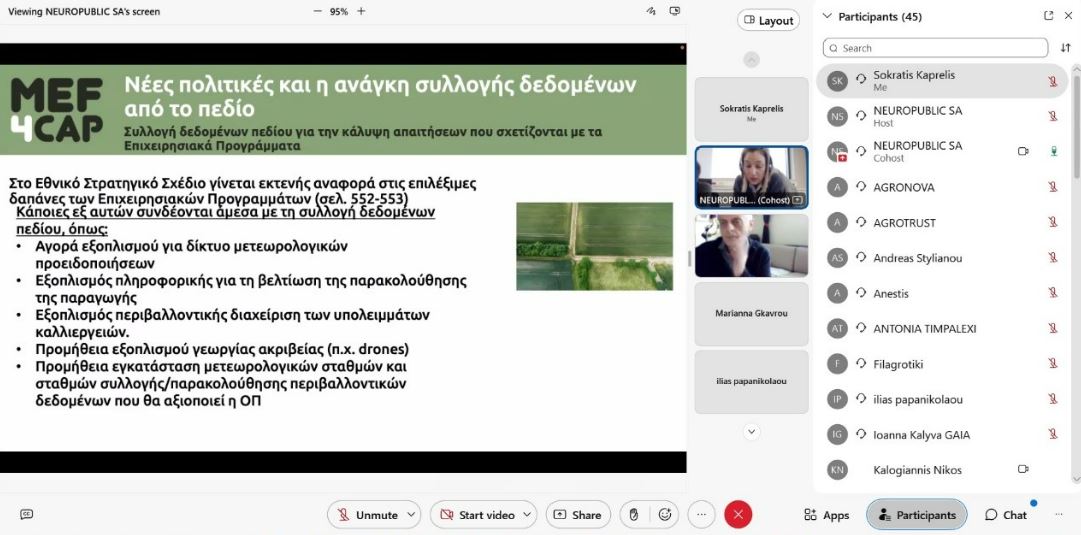
Presentations and discussions at our National Workshop in Greece
During our National Workshop in Greece, we ran a questionnaire and based on the findings, most stakeholders have a decent familiarity with digital technologies. Half of the respondents already use digital technologies, while a quarter of them plan to adopt a digital solution this year. The most popular digital solutions stated were: GPS; digital farm book; FMIS; geo-tagged photos; and weather stations.
Regarding data sharing, 80% of respondents stated that they would be incentivised to share their own data, if they received similar data from other local producers in return. The other 20% were in favour of free data flow among producers.
Regarding the sharing of farm book data with governmental organisations (such as paying agencies and statistical authorities) or environmental protection organisations (for use in protecting biodiversity, combating climate change, and monitoring water quality), respondents’ opinions were more varied. About 45% stated that a possible incentive for sharing their data would be to get similar data from other parties, about 15% would like to get financial benefits (money in return for data) while the remaining respondents believe that no type of exchange is needed and data flows should be free.
The last part of the questionnaire focused on the importance of traceability in the agri-food value chain. Here, the majority of the respondents (80%) agreed that sharing agri-data with consumers (location, area, type of farm) could boost the final value of the product and benefit the producer. A similar number of a participants (75-80%) also agreed that: “Sharing farm-book records (such as pesticide, fertiliser, and irrigation applications) with processing centres or food retailers (such aslarge supermarkets) could strengthen producer bargaining position.”
If you would like more information read the Lessons Learnt brief.